

ARTICLE:
The Income Squeeze: How Market Concentration Is Reshaping Equity Returns
By Matthew Bartolini, CFA, CAIA | Global Head of Research Strategists, State Street Investment Management
November 7, 2025
 Discover how rising market concentration in U.S. equities is driving strong returns but causing income from dividends to hit historic lows.
The U.S. equity market has never been more concentrated. The top stocks make up an astounding 38% of overall market capitalization – more than double the 17% from a decade ago and compared to 23% from the turn of the century.1 While this concentration has driven strong returns, it has also eroded the market’s ability to generate income.
Income’s shrinking role in equity returns
Over the past 55 years, broad U.S. equities have delivered an average annual total return of 9.9%,2 with 7.7% coming from price appreciation.3 That means dividend income contributed 215 basis points (bps), or 21%, to the total return.
This long-term average masks a significant shift in the current income landscape. On a rolling five-year basis, the income return has not been above 200 bps since 1998 (Figure 1). Even after a modest rebound in the mid-2010s, income’s contribution is approaching all-time lows.
The shrinking income contribution is largely due to today’s historically low dividend yields. The U.S. equity market’s trailing 12-month dividend yield stands at just 1.15%, in the bottom second percentile of historical observations4 and just 10 bps away from an all-time low. And the rolling trend continues to decline (Figure 1).
Importantly, the current yield on equities is below both the current inflation rate (2.9% CPI year-over-year)5 and five-year inflation expectations (3.4%).6 This means equities are now delivering negative real income, a trend likely to persist if yields and inflation expectations remain where they are.

Sector shifts impact today’s low income
Blaming equities’ low-income returns on low dividend yields is just part of the story. The real driver is the changing composition of the equity market.
In 1990, the top three sectors by index weight were:
- Energy: 14.83% weight, 4.1% yield7
- Industrials: 13.73% weight, 3.4% yield8
- Consumer Staples: 13.07% weight, 2.5% yield9
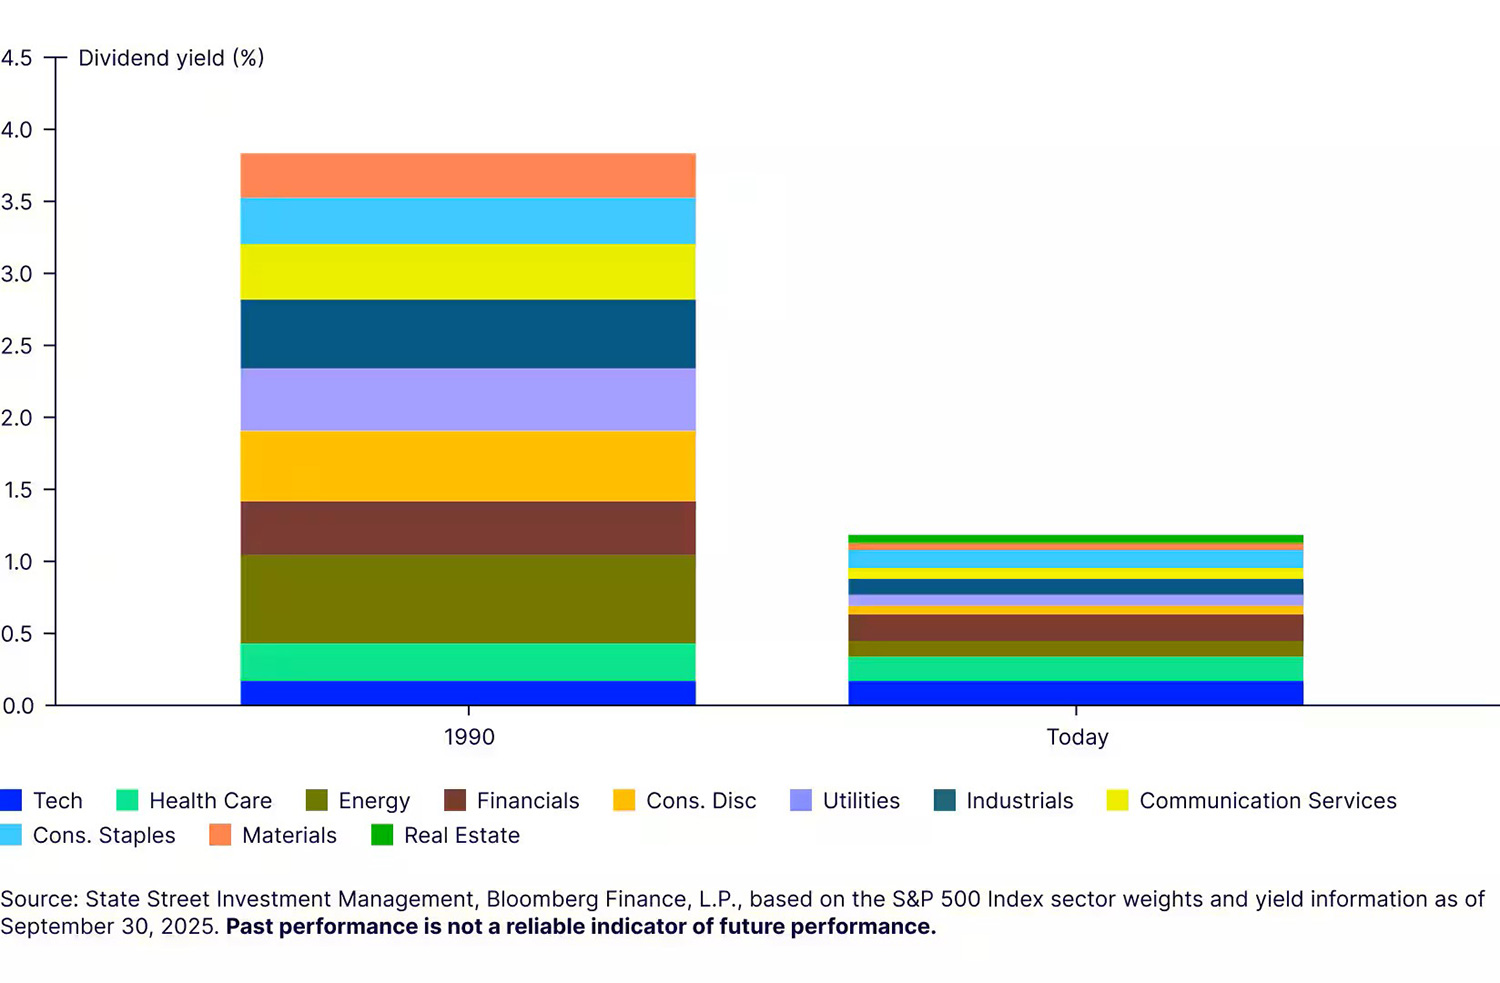
Together, the top three sectors had a combined weighted dividend yield of 1.41% – higher than today’s whole market dividend yield of 1.15%.10 And today’s top three sectors’ weighted dividend yield is just 0.44% – largely due to the Information Technology sector, which makes up 33.9% of the index, having the lowest yield of all 11 GICS sectors, just 0.5%.11
Interestingly, both today and in 1990, the top three sectors contributed roughly 38% of the market’s total dividend yield. The difference is that in 1990 those top three sectors accounted for only 42% of total market capitalization, compared to 60% today. This shift illustrates how greater concentration has dampened income generation.
Today’s lower income is also more narrowly sourced compared to 1990 (Figure 2). Now even traditionally high-yielding sectors like Utilities, Consumer Staples, Energy and Financials contribute little – not because of low yields, but because their market cap weights have shrunk. In fact, Utilities, Consumer Staples and Energy each make up less than 5% of the Index, despite offering yields above 2.5%.12
Figure 2: Income contribution by sector
What if sector weights had not shifted?
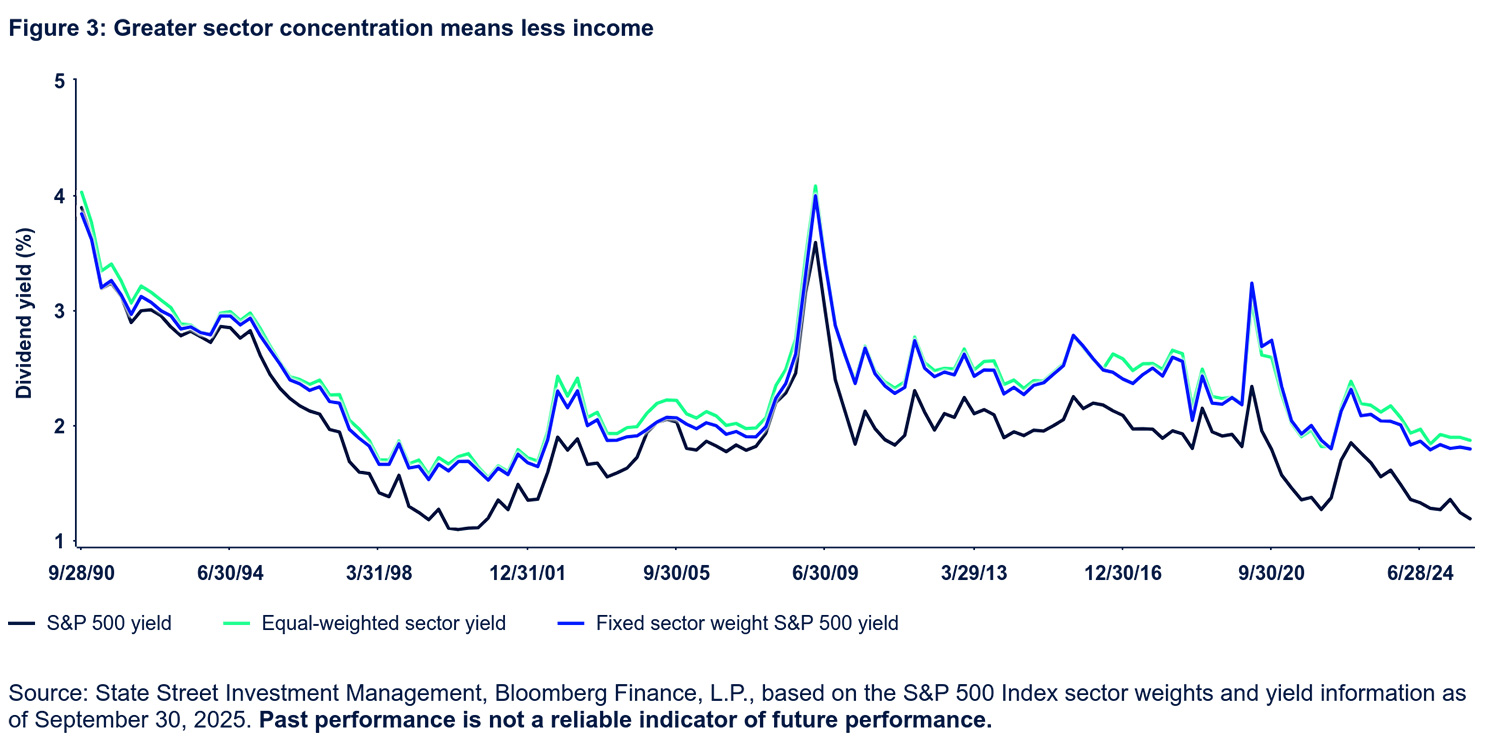
The decline in income from equities isn’t about just lower yields – it’s also about which sectors dominate the market today. To isolate this effect, we can look at two hypothetical scenarios:
- Fixed 1990 weights: For example, if we kept sector weights constant (e.g., the Energy weight at 14.8%) but used actual dividend yields over time, the resulting yield would be consistently higher than what the market has delivered.
- Equal weighted yield: Giving each sector the same weight removes the impact of market cap shifts and also results in a higher yield than the actual market yield.
Both theoretical yield profiles exceed the actual realized yield on broad equities since 1990 (Figure 3).
Given that in each time series the same yield data for each sector is used, but the market cap weights are adjusted, the logical conclusion is that sector composition has been a primary driver of equities being sapped of income potential.
Buybacks dominate dividends, impacting income
The way firms return shareholder value has compounded the drop in income.
In the 1990s, S&P 500 companies paid out an average of 46% of their earnings as dividends.13 Today, that percentage is just 30%, as firms increasingly favor share buybacks over dividends.14 While buybacks can support share prices and total return, they don’t provide the steady, predictable cash flows that income-focused investors – particularly retirees – depend on.
Notably, up until 2005, S&P 500 firms returned nearly the same amount of capital through dividends and buybacks.15 But as firms started to realize the benefits of buybacks from a financial flexibility and tax efficiency perspective, buyback amounts began to outpace dividends.
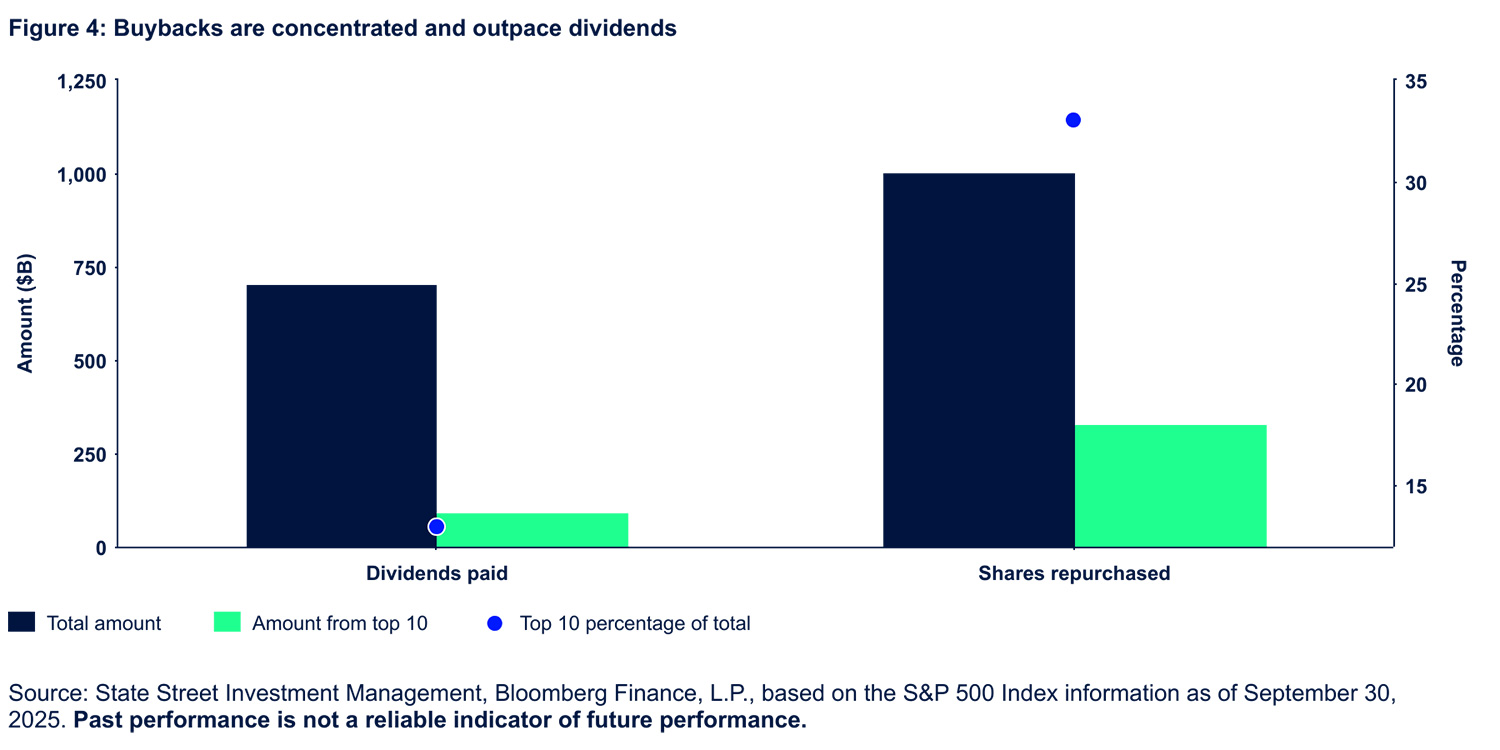
In the past 12 months, U.S. companies have spent almost $1 trillion on share buybacks, compared to $700 billion in dividends.16 While both figures are substantial, concentration effects continue to impact the market’s income profile.
The top 10 firms by market capitalization were responsible for 33% of total buybacks, while they accounted for just 13% of total dividends (Figure 4). This imbalance underscores a key trend of buybacks outpacing dividends. As a result, the S&P 500 buyback yield has consistently exceeded the S&P 500 dividend yield, which poses a challenge for income-oriented investors who rely on steady distributed cash flows.
How to adjust portfolios for declining dividends
Given income has historically contributed 200 bps to annual returns and that contribution is now lower, future total returns may fall short of historical averages. For U.S. equities to maintain past performance levels, earnings growth will need to do more of the heavy lifting. And right now, that earnings growth is priced at extreme highs – setting the bar high to outperform expectations.
This will lead income-oriented investors – a demographic that’s growing as more people enter retirement – to look beyond broad U.S. equities to a more diversified set of income-generating assets, including:
- Non-US markets: The yields for developed ex-U.S. (2.8%) and emerging markets (2.4%) are structurally higher than U.S. markets17
- High dividend equities: Strategies focused on high dividend paying stocks may deliver dividends by taking on some factor (e.g., Value) or sector-specific risks (unless sector neutral)
- Derivative income: Although they cap some upside potential, using options (typically selling calls) on sector ETFs can generate extra income
- Hybrid income: Non-traditional markets like preferred stocks and convertible securities combine equity and bond risk profiles
- Active credit: High income active credit strategies blend below investment-grade segments like senior loans, fixed rate high yield and collateralized loan obligations (CLOs) to pursue income with an equity bias, given high yield bonds often move in the same direction as U.S. equities (with a beta of 0.45).18
In short, because broad U.S. equities are no longer a reliable source of income, investors should consider rethinking the type of risk they’re willing to take and diversifying across a broader set of income-generating assets.
For more insights check out our market trends page.
Photo Credit: Provided by State Street to TAYF website on Oct. 29, 2025
FOOTNOTES
1 Bloomberg Finance, L.P., as of October 8, 2025, based on the S&P 500 Index.
2 Bloomberg Finance, L.P., data for the MSCI USA Index and based on State Street Investment Management calculations as of September 30, 2025.
3 Bloomberg Finance, L.P., data for the MSCI USA Index and based on State Street Investment Management calculations as of September 30, 2025.
4 Bloomberg Finance, L.P., as of October 8, 2025, based on the S&P 500 Index.
5 Bloomberg Finance, L.P., as of October 8, 2025.
6 Bloomberg Finance, L.P., as of October 8, 2025, based on the Federal Reserve Inflation Expectations Median 1-year Ahead Expected Inflation Rate.
7 Bloomberg Finance, L.P., as of October 8, 2025, based on the S&P 500 Index.
8 Bloomberg Finance, L.P., as of October 8, 2025, based on the S&P 500 Index.
9 Bloomberg Finance, L.P., as of October 8, 2025, based on the S&P 500 Index.
10 Bloomberg Finance, L.P., as of October 8, 2025, based on the S&P 500 Index.
11 Bloomberg Finance, L.P., as of October 8, 2025, based on the S&P 500 Index.
12 Bloomberg Finance, L.P., as of October 8, 2025, based on the S&P 500 Index.
13 Bloomberg Finance, L.P., as of October 8, 2025, based on the S&P 500 Index.
14 Bloomberg Finance, L.P., as of October 8, 2025, based on the S&P 500 Index.
15 Bloomberg Finance, L.P., as of October 8, 2025, based on the S&P 500 Index.
16 Bloomberg Finance, L.P., as of September 30, 2025, based on the S&P 500 Index.
17 Bloomberg Finance, L.P., as of October 8, 2025, based on the MSCI World Ex-US Index and the MSCI Emerging Market Index.
18 Bloomberg Finance, L.P., as of October 8, 2025, based on the Bloomberg US Corporate High Yield Index and the S&P 500 Index monthly returns from 2005-2025.
Important risk information
Investing involves risk including the risk of loss of principal.
The whole or any part of this work may not be reproduced, copied or transmitted or any of its contents disclosed to third parties without State Street Investment Management’s express written consent.
All information is from SSGA unless otherwise noted and has been obtained from sources believed to be reliable, but its accuracy is not guaranteed. There is no representation or warranty as to the current accuracy, reliability or completeness of, nor liability for, decisions based on such information and it should not be relied on as such.
The information contained in this communication is not a research recommendation or ‘investment research’ and is classified as a ‘Marketing Communication’ in accordance with the applicable regional regulation. This means that this marketing communication (a) has not been prepared in accordance with legal requirements designed to promote the independence of investment research (b) is not subject to any prohibition on dealing ahead of the dissemination of investment research.
This communication is directed at professional clients (this includes eligible counterparties as defined by the “appropriate EU regulator”) who are deemed both knowledgeable and experienced in matters relating to investments. The products and services to which this communication relates are only available to such persons and persons of any other description (including retail clients) should not rely on this communication.
The information provided does not constitute investment advice and it should not be relied on as such. It should not be considered a solicitation to buy or an offer to sell a security. It does not take into account any investor’s particular investment objectives, strategies, tax status or investment horizon. You should consult your tax and financial advisor.
Past performance is not a reliable indicator of future results.
The views expressed in this material are the views of the Americas ETF Research Team through the period ended October 8, 2025, and are subject to change based on market and other conditions. This document contains certain statements that may be deemed forward-looking statements. Please note that any such statements are not guarantees of any future performance and actual results or developments may differ materially from those projected.
The views expressed in this material are subject to change based on market and other conditions. It should not be considered a solicitation to buy or an offer to sell any security. It does not take into account any investor’s particular investment objectives, strategies, tax status or investment horizon. There is no representation or warranty as to the current accuracy of such information, nor liability for decisions based on such information.
The S&P 500® Index is a product of S&P Dow Jones Indices LLC or its affiliates (“S&P DJI”) and have been licensed for use by State Street Global Advisors. S&P®, SPDR®, S&P 500®,US 500 and the 500 are trademarks of Standard & Poor’s Financial Services LLC (“S&P”); Dow Jones® is a registered trademark of Dow Jones Trademark Holdings LLC (“Dow Jones”) and has been licensed for use by S&P Dow Jones Indices; and these trademarks have been licensed for use by S&P DJI and sublicensed for certain purposes by State Street Global Advisors. The fund is not sponsored, endorsed, sold or promoted by S&P DJI, Dow Jones, S&P, their respective affiliates, and none of such parties make any representation regarding the advisability of investing in such product(s) nor do they have any liability for any errors, omissions, or interruptions of these indices.
State Street Global Advisors, One Congress Street, Boston, MA 02114.
State Street Global Advisors (SSGA) is now State Street Investment Management. Please click here for more information.
©2025 State Street Corporation – All Rights Reserved.
Expiry Date: October 31, 2026
8555158.1.1.AM.RTL
The views and opinions expressed in this article are solely those of the author and do not necessarily reflect the position of The Truth About Your Future or its affiliates. This content is provided for educational and informational purposes only and does not constitute investment, financial, legal, tax, or accounting advice, nor an offer, solicitation, or recommendation to buy or sell any security or other asset. Information is current as of the date of publication and may become outdated; no representation is made as to its accuracy or completeness. Publication does not constitute an endorsement of the author, the author’s firm, or any product or service referenced, and the author may hold positions in the assets discussed. Readers should consult their own qualified professionals before making any financial decisions.
NOTE: Unless otherwise mentioned, all graphics on this website pertaining to articles are licensed and owned by THETAYF. This website owns all of these images.