

ARTICLE:
What Industry ETFs Add to Your Sector and Industry Strategy
By Anqi Dong, CFA, CAIA | Senior Research Strategist, State Street Investment Management
By Mariola Pokorska, CFA | Research Analyst, State Street Investment Management
November 20, 2025
Maximize your portfolio strategy by understanding the distinct roles of sector and industry ETFs, targeting industry trends and niche opportunities for alpha.
Many investors view sectors and industry ETFs as if they’re a pair – like salt and pepper on a dinner table. In fact, they’re mentioned together so frequently that it’s easy to forget they play different roles in your portfolio.
Yes, investors use both sector and industry ETFs to express their market views, position for macroeconomic changes and industry trends, and manage portfolio risks.
But sector funds target broad industry categories with shared economic characteristics. And industry funds focus on a narrower group of companies that offer similar products or services.
That is, sectors, like salt, provide the most foundational seasoning for a portfolio. And industries, like pepper, add nuance, complexity and variation, influencing a portfolio’s flavor in more targeted ways.
Distinguishing between the roles of sector and industry funds
While grouping sector and industry funds together might feel natural, it can lead to oversimplified strategies and missed opportunities. How can you improve? Use sector funds for exposure to broad economic trends and to position different phases of the business cycle, and industry funds to target more specific market themes or groups of companies in a narrow niche.
Importantly, the precision of industry ETFs can amplify the impact of a sector strategy, enabling you to:
- Pursue greater alpha
- Position for industry trends and policy shifts
- Harness macro trends
- Manage portfolio risks
Pursue greater alpha with wider dispersion
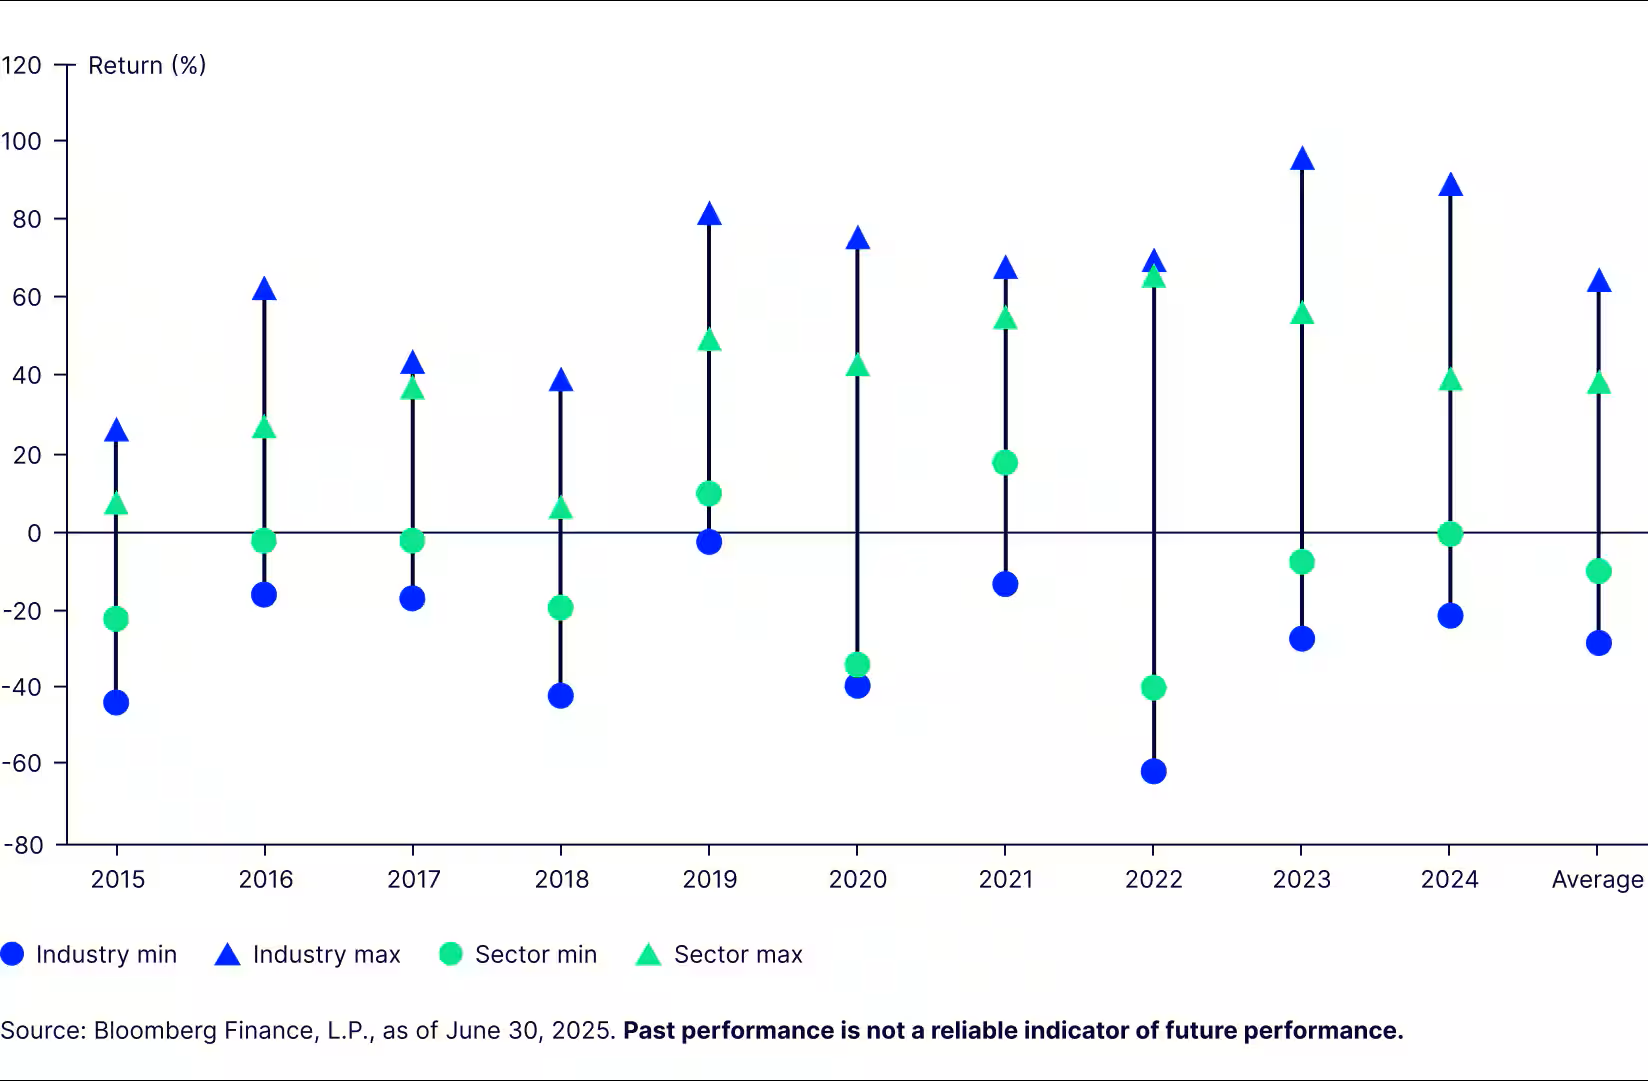
Industries have historically exhibited wider dispersion than broad sectors due to their larger investment opportunity set. The gap between the best- and worst-performing industries has been consistently wider than that of sectors (Figure 1). Since correlation between industries in the same sector is less than 1,1 greater alpha opportunities may exist at the industry level due to unique industry drivers.
For example, as booming AI infrastructure investment boosts demand for power infrastructure, the electrical equipment industry in the Industrials sector saw strong demand for products that power AI data centers.
The industry gained 81% since the end of 2023, outperforming Industrials and the broad market by 45% and 46%, respectively2. Meanwhile, the transportation industry – also part of the Industrials sector – struggled amid a weaker economic growth outlook and trade uncertainty, gaining 0.8% over the same period.3
Figure 1: Industries have exhibited wider dispersion than sectors
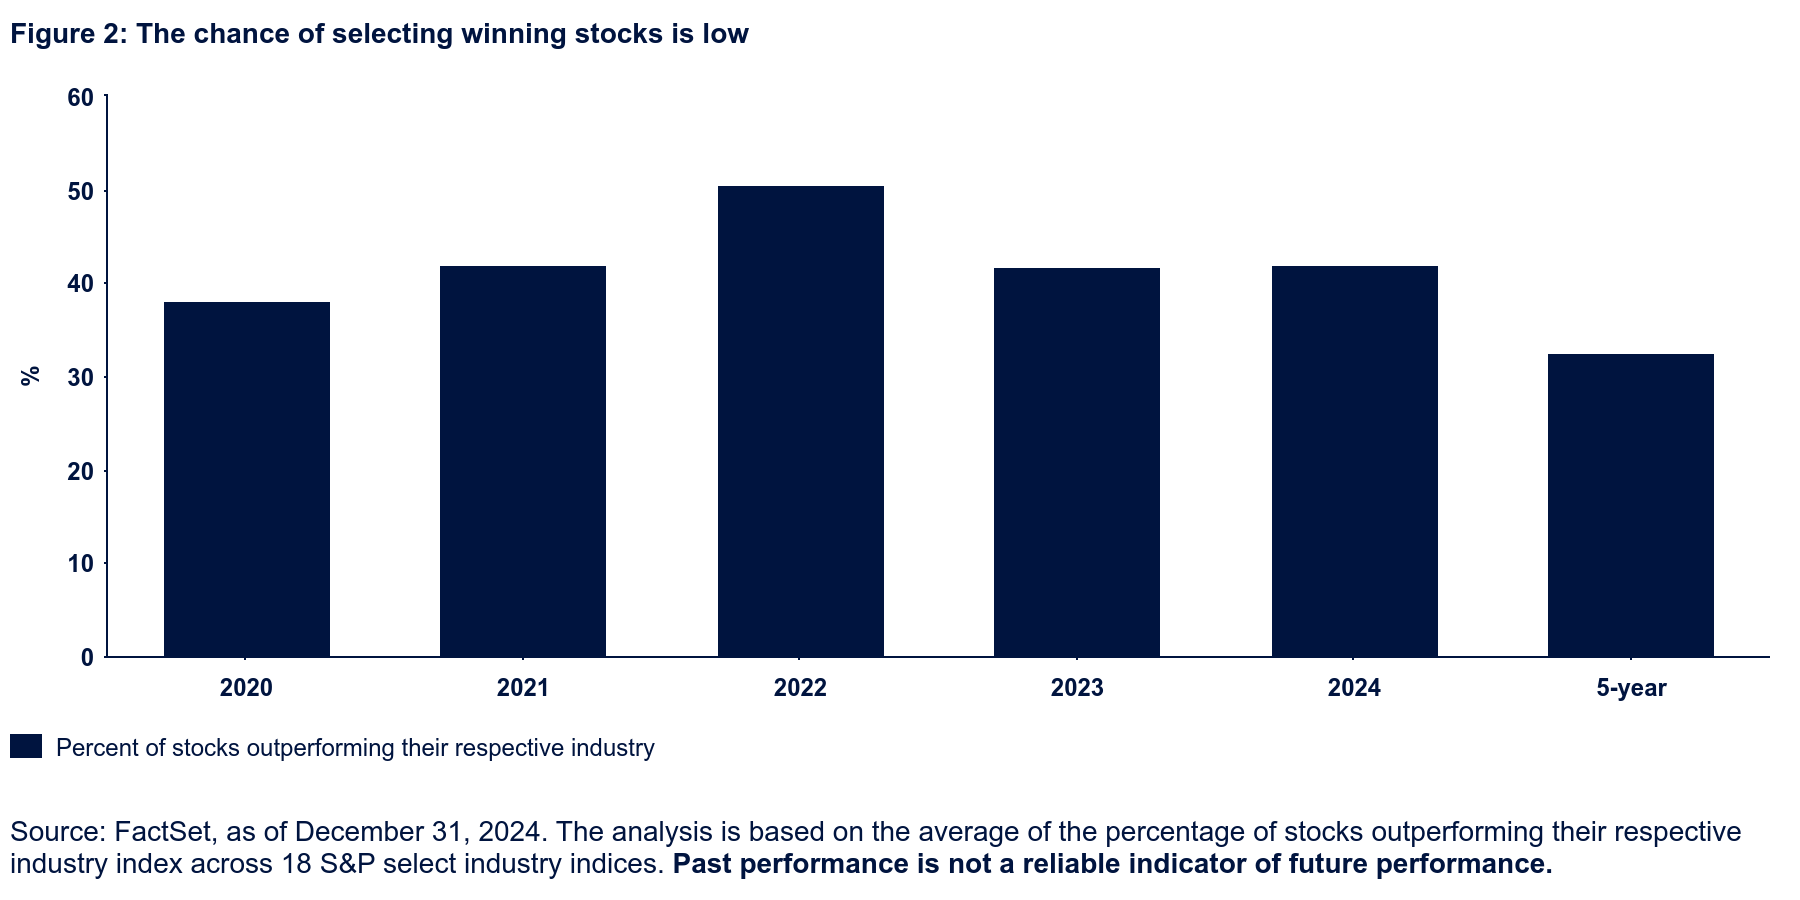
Notably, some investors use individual stocks to pursue greater alpha. But while stocks clearly provide a larger opportunity set and exhibit greater dispersion than industries, the chance of selecting stocks that will outperform their respective industry is less than half most of the time. And the chance is diminished to less than a third over a longer-term investment horizon (Figure 2). Therefore, for investors who have high convictions on industry or macro trends without strong stock picking skills, industry exposures may provide a better chance to generate alpha.
Gain exposure to secular trends and policy shifts
Over nearly two decades of consistent innovation and advances, the Technology sector has returned an annualized rate of 16.4%.4 But gains of industries within Tech have been uneven – with the best-performing Tech industry outperforming the worst by 8.7% on an annualized basis.5
Leadership shifts over time as development of new technologies creates new beneficiaries.
For instance, as cloud computing matured in the 2010s, infrastructure as a service (IaaS) cloud computing models transformed business IT infrastructure and redefined how software is created, deployed, and distributed. No longer did software development involve costly physical infrastructure and upfront investment.
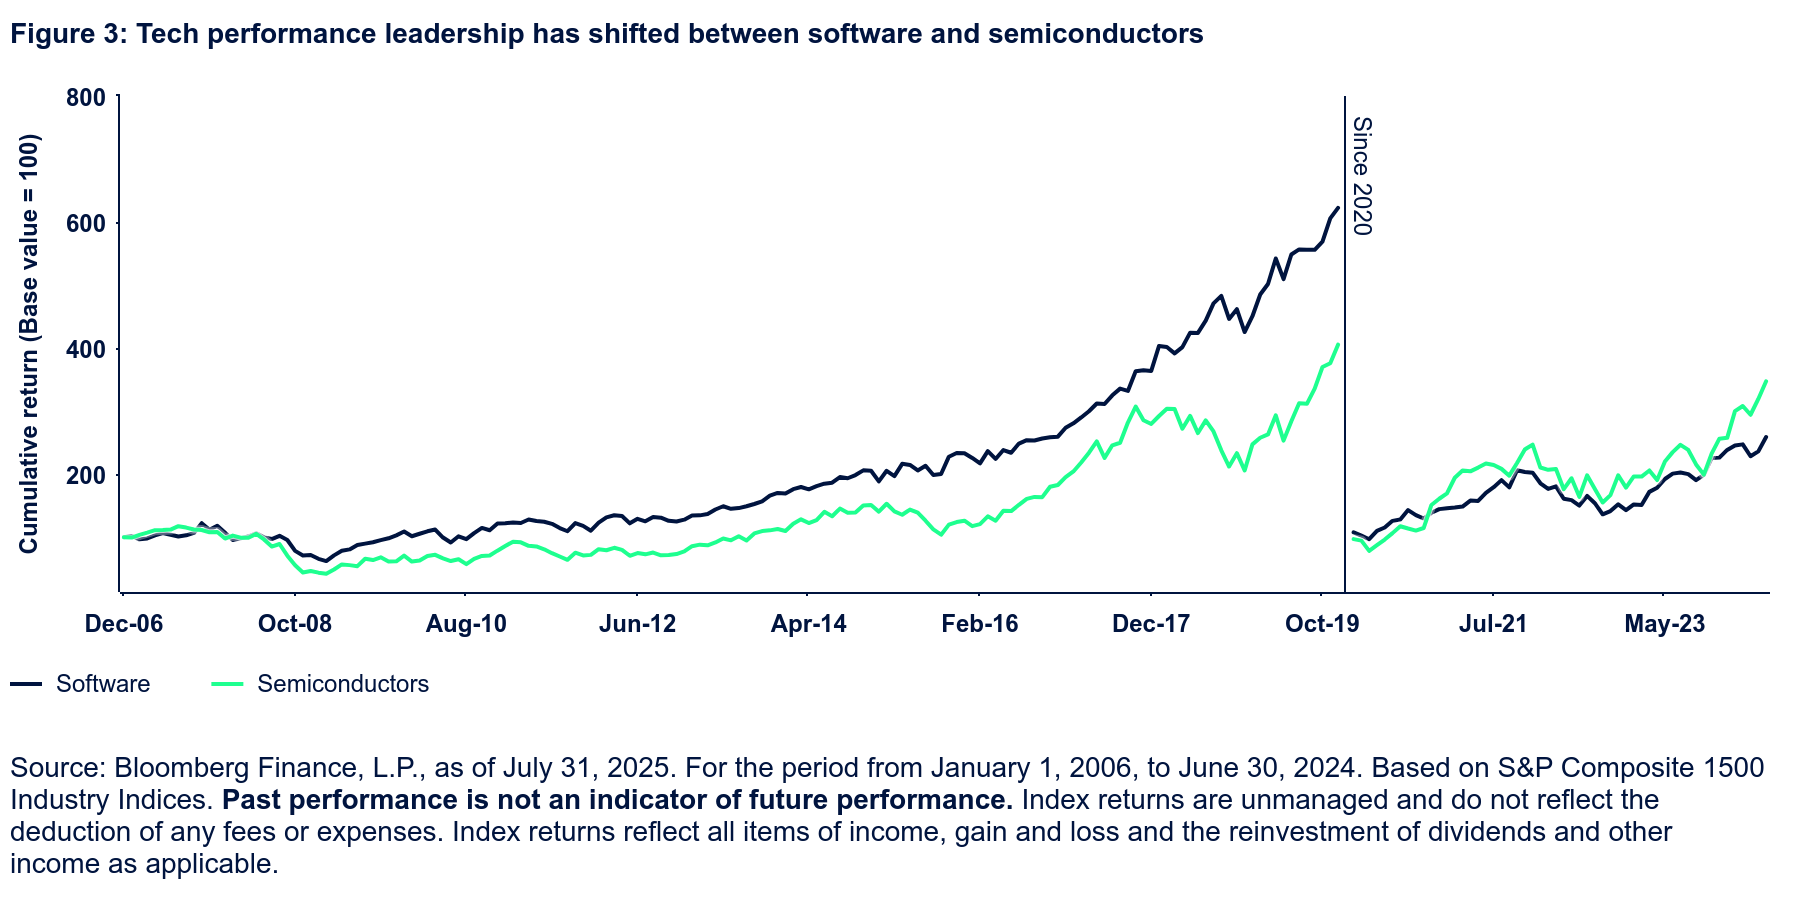
Improved capital efficiency and predictable revenue streams from the new software as a service (SaaS) model contributed to software’s industry leadership in the 2010s, leading it to outperform the worst-performing Tech industry – semiconductors – by 142% on a cumulative basis (Figure 3).
More recently, accelerating digitalization driven by the COVID pandemic and the beginning of AI revolution in the early 2020s has fueled demand for computing chips. And easy access to low-cost coding capability through AI has lowered the barrier for new entrants, threatening the SaaS business model. As a result, the semiconductor industry took charge, outperforming the software industry – Tech’s worst performing industry – by 134% in the early 2020s (Figure 3).
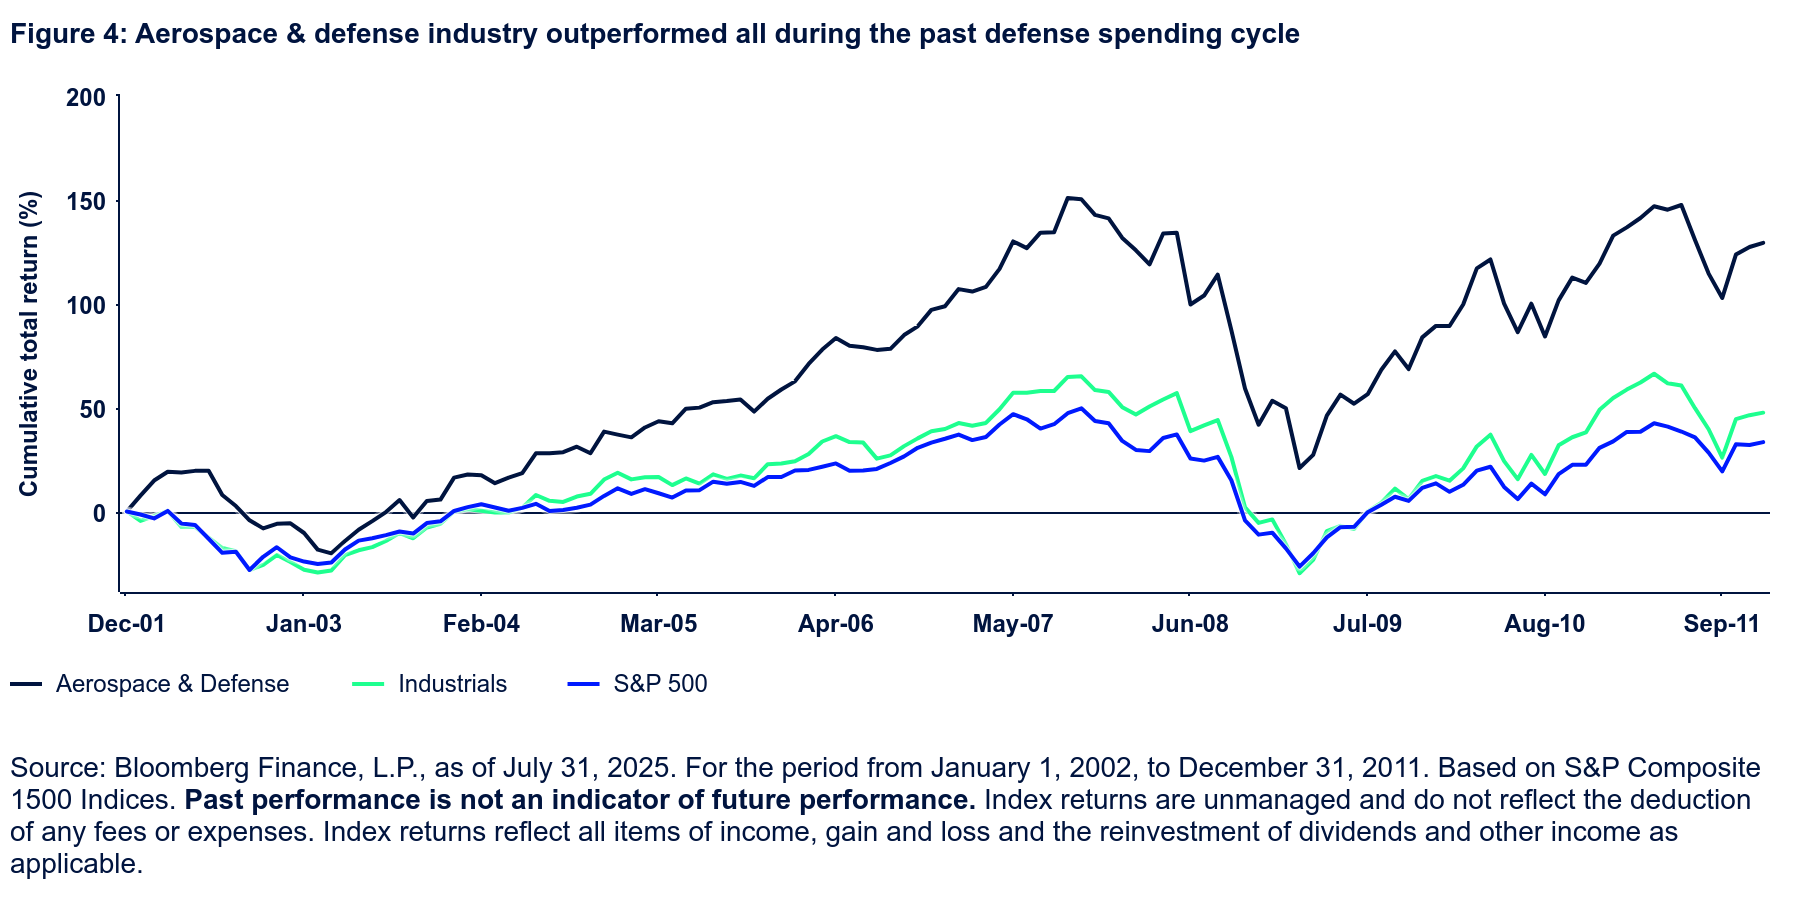
Fiscal policy and geopolitics can also benefit specific industries more than they do broad sectors. For example, aerospace & defense stocks have outperformed the broad Industrials sector over the past defense spending cycle (Figure 4).
Consider that following the 9/11 attack, US defense spending nearly doubled in 10 years, increasing from 3% to almost 5% of GDP.6 And for most years during that period, the US aerospace & defense industry posted stronger earnings growth than the Industrials sector and broad market, including during two economic recessions.7 As a result, aerospace & defense outperformed 82% and 90% over the sector and broad market, respectively, on a cumulative basis (Figure 4).
And aerospace & defense continues to be supported by global defense spending increasing 16% in the past two years due to the Russia-Ukraine war.
Capitalize on high sensitivity to macroeconomic tailwinds
Because industry ETFs include companies with greater similarities in business focus, operation models, and market segments than the diverse companies that make up sectors, it follows that macroeconomic variables impact industries in a greater way than they do the broad sectors.
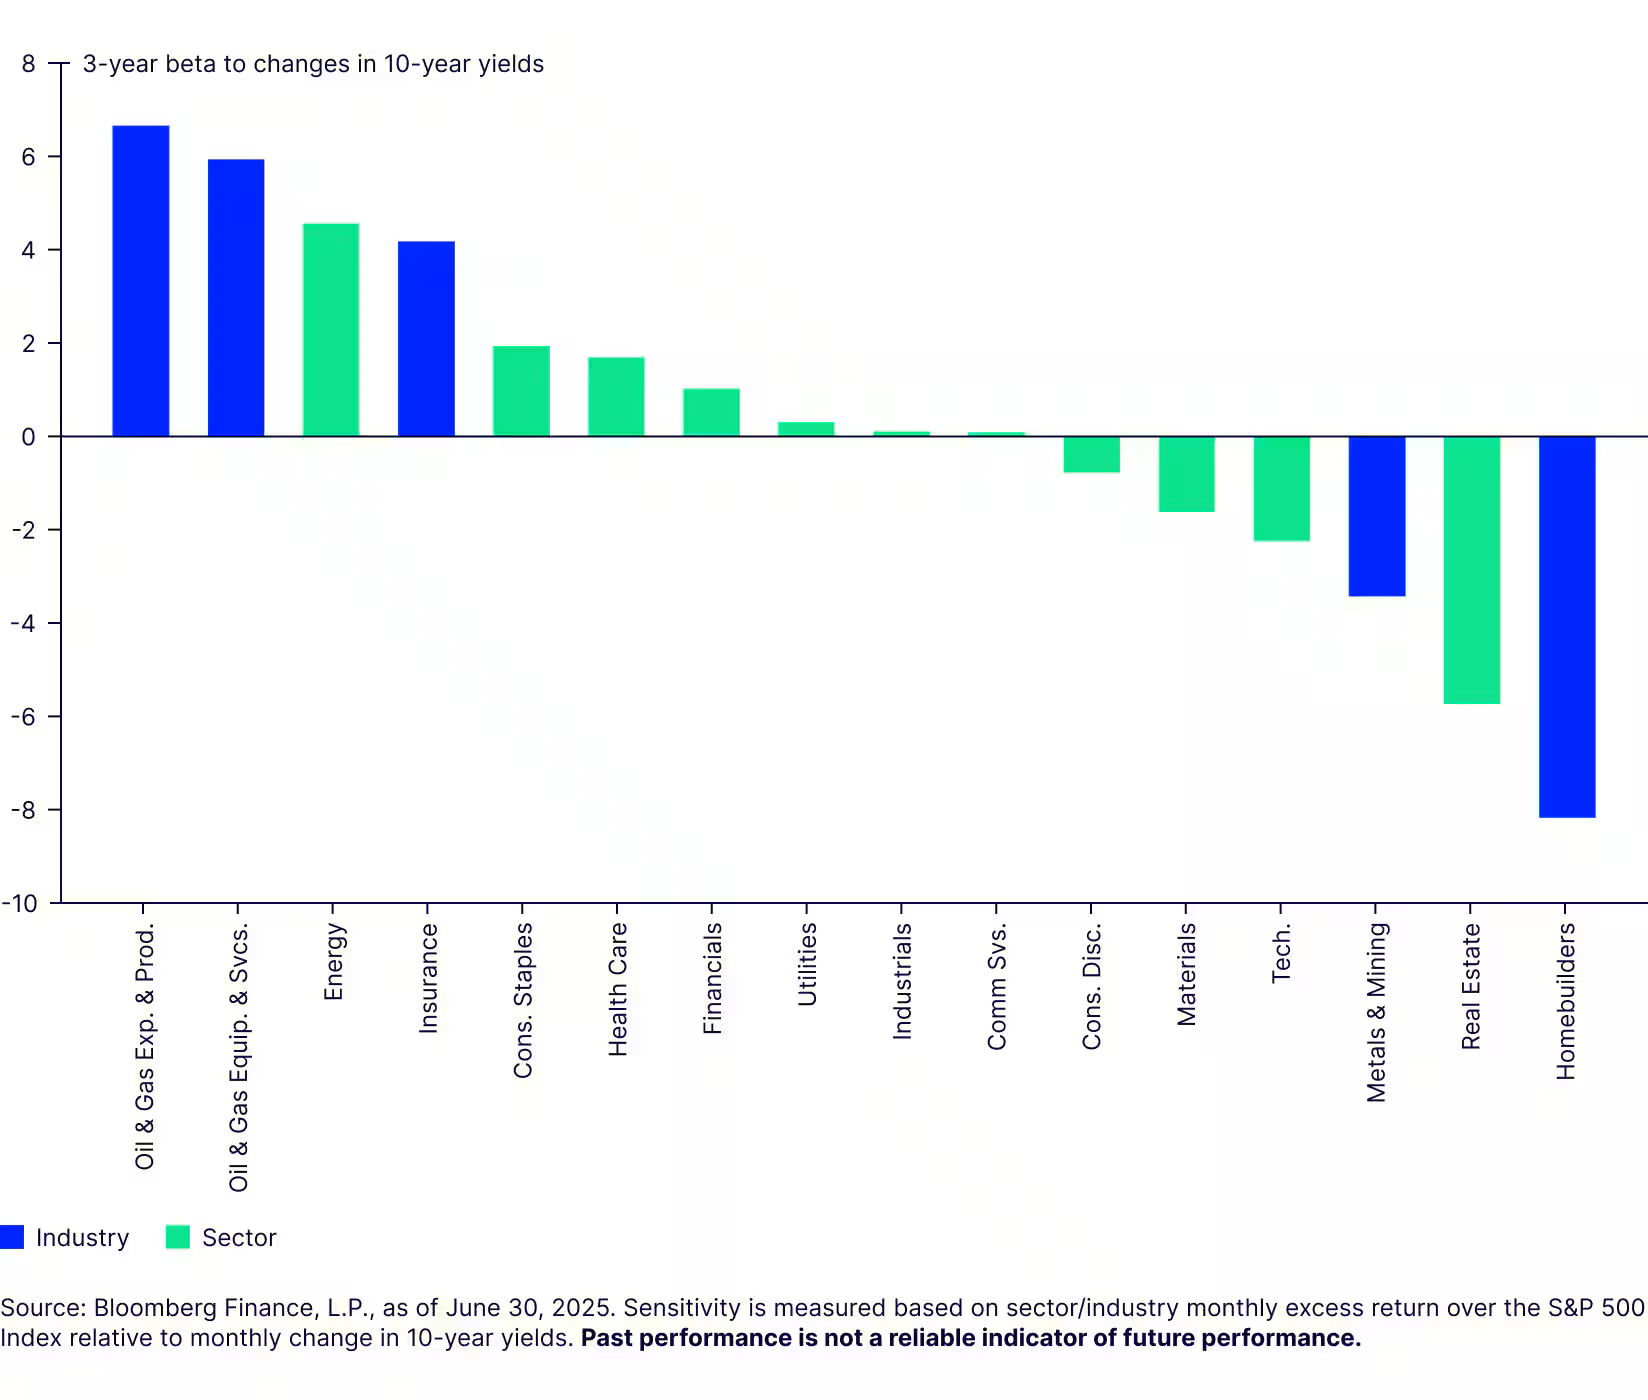
For example, while Energy and Real Estate have exhibited one of the highest positive and negative sensitivities, respectively, to 10-year Treasury yields, narrower industry exposures like the oil & gas and homebuilders industries have shown greater beta than the 11 sectors (Figure 5).
More importantly, insurance and homebuilder industries’ beta sensitivity are 4x and 15x that of their respective sectors, Financials and Consumer Discretionary.
In other words, a 10-basis point change in 10-year yields may provide greater tailwinds for the insurance and homebuilders industries than for the Financials and Consumer Discretionary sectors. From a capital efficiency perspective, investors may use less capital by allocating to those two industries than their respective sectors to achieve the same level of beta exposure to long-term yields in their equity portfolios.
Figure 5: Certain industries have exhibited greater sensitivity to 10-year yields
Macro events can sometimes benefit companies in the same industry, but not significant enough to move the broader sector. For example, as the Trump administration increased tariffs on steel, aluminum and copper in the first half of 2025, the US metal and mining industry benefited from the trade protection, gaining 23.6% and beating the sector and broad equities by 14% and 13.3%, respectively.8
Over the same time period, the Materials sector lagged broad equities due to the weak performance of the chemicals industry – the largest industry in the sector and accounting more than half of the sector market cap – driven by weak demand during a manufacturing slowdown.
Adjust portfolio risk with industry bets
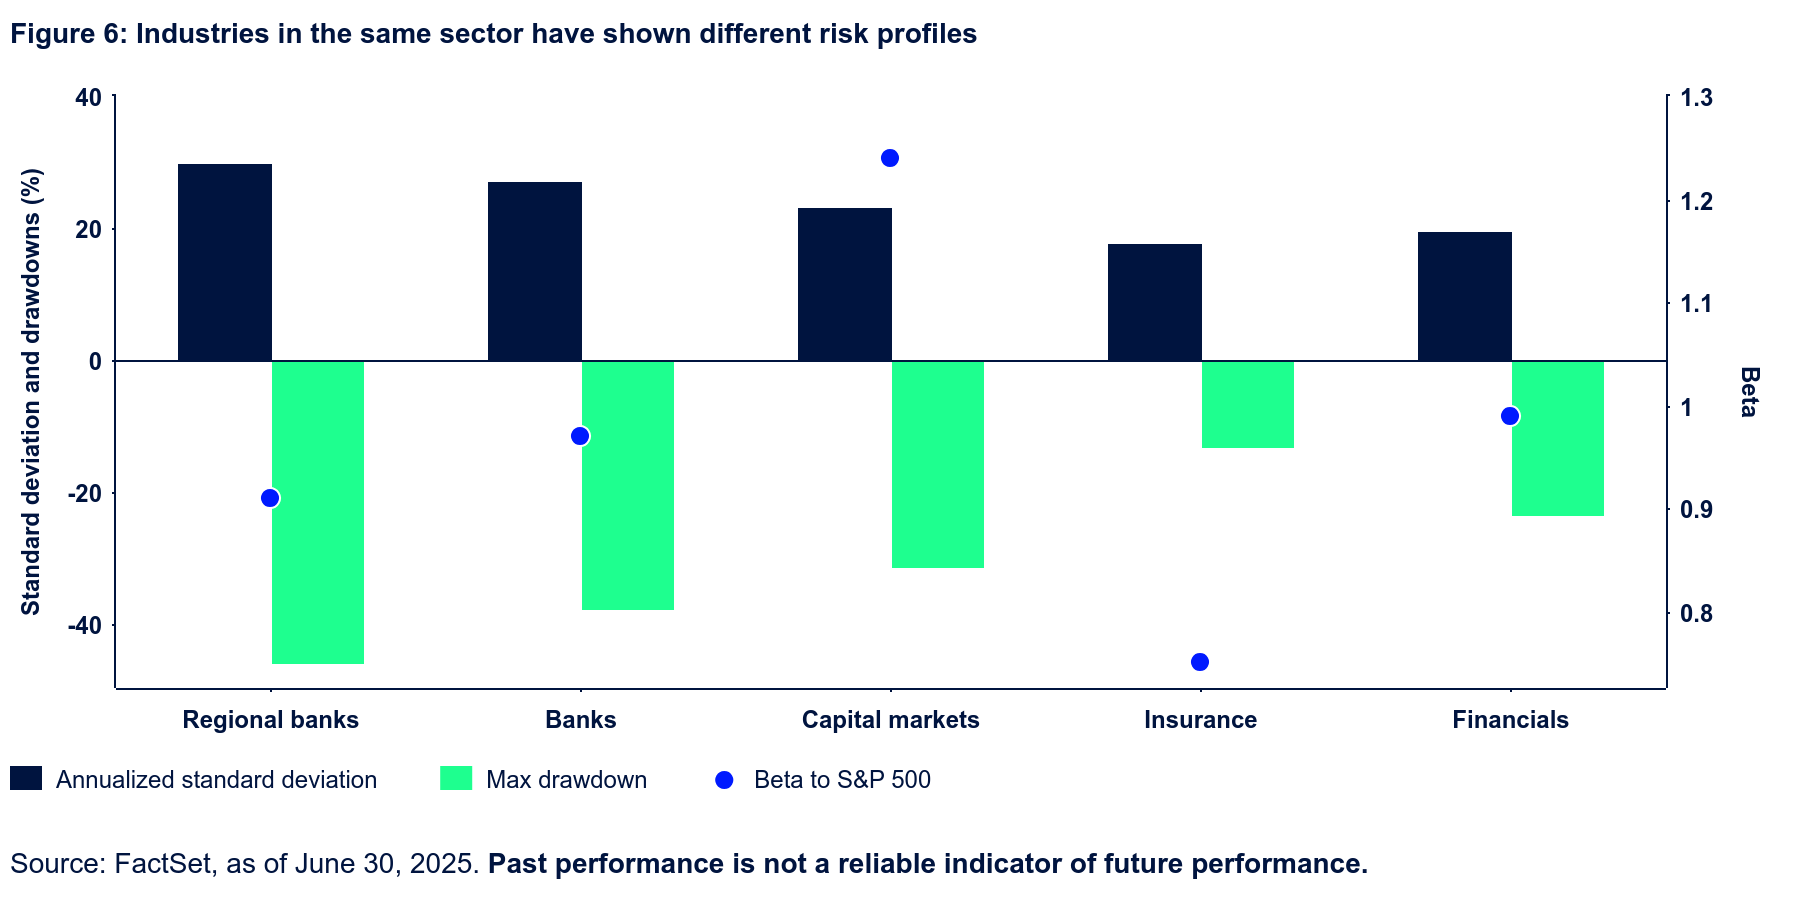
Due to their varied businesses, industries in the same sector may exhibit different volatility and sensitivity to broad equity moves.
For example, the insurance industry has shown lower volatility, drawdowns, and beta sensitivity to broad equities than other Financials industries and the Financials sector due to its less cyclical business and stable cash flows (Figure 6).
Investors may use insurance industry exposure to capture the benefits of higher rates on financial stocks without taking on significant market risks compared to other financial industries with higher volatility and market beta, like banks and capital markets.
Looking ahead: From enhanced returns to risk management
With 11 GICS sectors and a broad universe of industry ETFs – whose numbers have more than doubled with assets growing eightfold over the past 15 years9 – investors now have more ways than ever to express their views and fine-tune their portfolios. Sector ETFs offer broad exposure, while industry ETFs allow you to zero in on alpha opportunities, leadership shifts, and macro trends with greater focus.
Of course, how you select your sector and industry exposures depends on both your investment goals and risk tolerance. And keep in mind that the size of your positions and rebalancing schedule will be more critical in managing industry exposures than in managing sectors, given industry funds’ narrower exposure.
Big picture, like salt and pepper, sector and industry funds are best used together – but knowing when to reach for one over the other is what gives your portfolio real depth and flavor.
Want to learn more about our sector and industry ETFs?
For more insights check out our market trends page.
FOOTNOTES
1 FactSet, as of June 30, 2025. Based on three-year rolling pairwise correlations of S&P 1500 industries in the same sector for 11 GICS sectors over the period between July 2017 and June 2025.
2 Bloomberg Finance, L.P., as of July 31, 2025. For the period from December 31, 2023, to July 31, 2025. The electrical equipment industry is represented by the S&P 1500 electrical equipment industry.
3 Bloomberg Finance, L.P., as of July 31, 2025. For the period from December 31, 2023, to July 31, 2025. The transportation industry is represented by the S&P Transportation Select Industry index.
4 Bloomberg Finance, L.P., as of June 30, 2025. For the period from December 31, 2006, to June 30, 2025. Based on the S&P 1500 Composite Information Technology Index. Past performance is not an indicator of future performance. Index returns are unmanaged and do not reflect the deduction of any fees or expenses. Index returns reflect all items of income, gain and loss and the reinvestment of dividends and other income as applicable.
5 Bloomberg Finance, L.P., as of June 30, 2025. For the period from December 31, 2006, to June 30, 2025. Based on the S&P 1500 Composite Information Technology Industry Indices. Past performance is not an indicator of future performance. Index returns are unmanaged and do not reflect the deduction of any fees or expenses. Index returns reflect all items of income, gain and loss and the reinvestment of dividends and other income as applicable.
6 Sipri.org, as of April 28, 2025. For the period from 2001 to 2011.
7 FactSet, as of June 30, 2025. For the period from 2001 to 2011.
8 Bloomberg Finance, L.P., as of June 30, 2025. The metals and mining industry and industrial sector are represented by the S&P 1500 metals & mining industry and industrials sector.
9 Bloomberg Finance, L.P., State Street Investment Management, as of June 30, 2025.
Important risk information
Investing involves risk including the risk of loss of principal.
The information provided does not constitute investment advice and it should not be relied on as such. It should not be considered a solicitation to buy or an offer to sell a security. It does not take into account any investor’s particular investment objectives, strategies, tax status or investment horizon. You should consult your tax and financial advisor.
The trademarks and service marks referenced herein are the property of their respective owners. Third party data providers make no warranties or representations of any kind relating to the accuracy, completeness or timeliness of the data and have no liability for damages of any kind relating to the use of such data.
Equity securities may fluctuate in value and can decline significantly in response to the activities of individual companies and general market and economic conditions.
Concentrated investments in a particular sector or industry tend to be more volatile than the overall market and increases risk that events negatively affecting such sectors or industries could reduce returns, potentially causing the value of the Fund’s shares to decrease.
The whole or any part of this work may not be reproduced, copied or transmitted or any of its contents disclosed to third parties without State Street Investment Management’s express written consent.
All information is from SSGA unless otherwise noted and has been obtained from sources believed to be reliable, but its accuracy is not guaranteed. There is no representation or warranty as to the current accuracy, reliability or completeness of, nor liability for, decisions based on such information and it should not be relied on as such.
Diversification does not ensure a profit or guarantee against loss.
Non-diversified funds that focus on a relatively small number of securities tend to be more volatile than diversified funds and the market as a whole.
Past performance is not a reliable indicator of future results.
The views expressed in this material are subject to change based on market and other conditions. It should not be considered a solicitation to buy or an offer to sell any security. It does not take into account any investor’s particular investment objectives, strategies, tax status or investment horizon. There is no representation or warranty as to the current accuracy of such information, nor liability for decisions based on such information.
The S&P 500® Index is a product of S&P Dow Jones Indices LLC or its affiliates (“S&P DJI”) and have been licensed for use by State Street Global Advisors. S&P®, SPDR®, S&P 500®,US 500 and the 500 are trademarks of Standard & Poor’s Financial Services LLC (“S&P”); Dow Jones® is a registered trademark of Dow Jones Trademark Holdings LLC (“Dow Jones”) and has been licensed for use by S&P Dow Jones Indices; and these trademarks have been licensed for use by S&P DJI and sublicensed for certain purposes by State Street Global Advisors. The fund is not sponsored, endorsed, sold or promoted by S&P DJI, Dow Jones, S&P, their respective affiliates, and none of such parties make any representation regarding the advisability of investing in such product(s) nor do they have any liability for any errors, omissions, or interruptions of these indices.
State Street Global Advisors, One Congress Street, Boston, MA 02114.
State Street Global Advisors (SSGA) is now State Street Investment Management. Please click here for more information.
©2025 State Street Corporation – All Rights Reserved.
Expiry Date: September 30, 2026
8601288.1.1.AM.RTL
The views and opinions expressed in this article are solely those of the author and do not necessarily reflect the position of The Truth About Your Future or its affiliates. This content is provided for educational and informational purposes only and does not constitute investment, financial, legal, tax, or accounting advice, nor an offer, solicitation, or recommendation to buy or sell any security or other asset. Information is current as of the date of publication and may become outdated; no representation is made as to its accuracy or completeness. Publication does not constitute an endorsement of the author, the author’s firm, or any product or service referenced, and the author may hold positions in the assets discussed. Readers should consult their own qualified professionals before making any financial decisions.
NOTE: Unless otherwise mentioned, all graphics on this website pertaining to articles are licensed and owned by THETAYF. This website owns all of these images.